Performance
Net sales
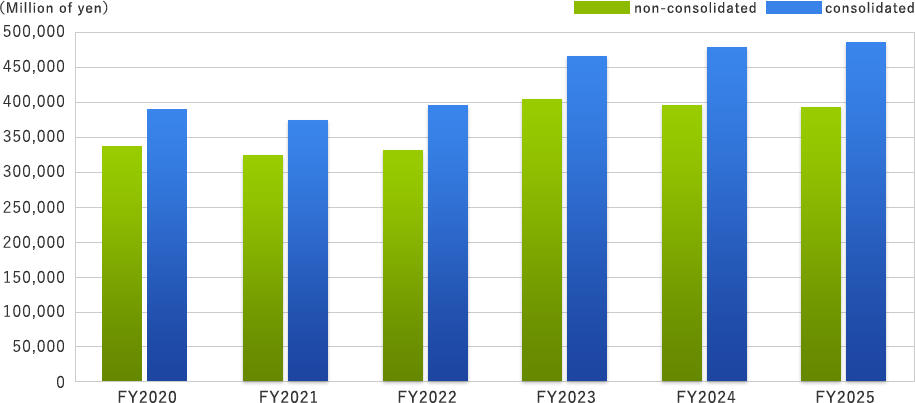
(Millions of yen)
| FY2020 | FY2021 | FY2022 | FY2023 | FY2024 | FY2025 | |
|---|---|---|---|---|---|---|
| non-consolidated | 337,432 | 322,568 | 333,007 | 404,832 | 398,602 | 395,647 |
| consolidated | 391,901 | 376,563 | 395,783 | 469,057 | 473,954 | 476,123 |
Net sales for Business Segment (FY2025)
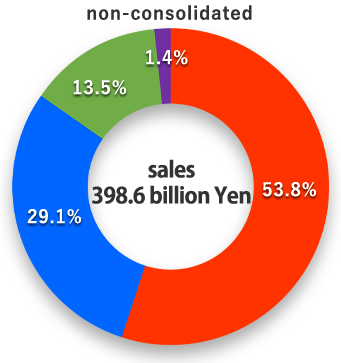
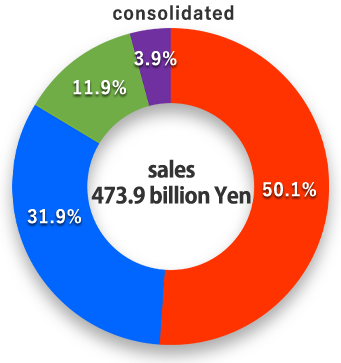

(Millions of yen)
| Electrical work | HVAC work | Power disribution line work | Other | sales | |
|---|---|---|---|---|---|
| non-consolidated | 212,842 | 124,188 | 53,322 | 5,293 | 395,647 |
| consolidated | 238,543 | 162,385 | 56,595 | 18,598 | 476,123 |
Changes in Net Sales of each department (non-consolidated)
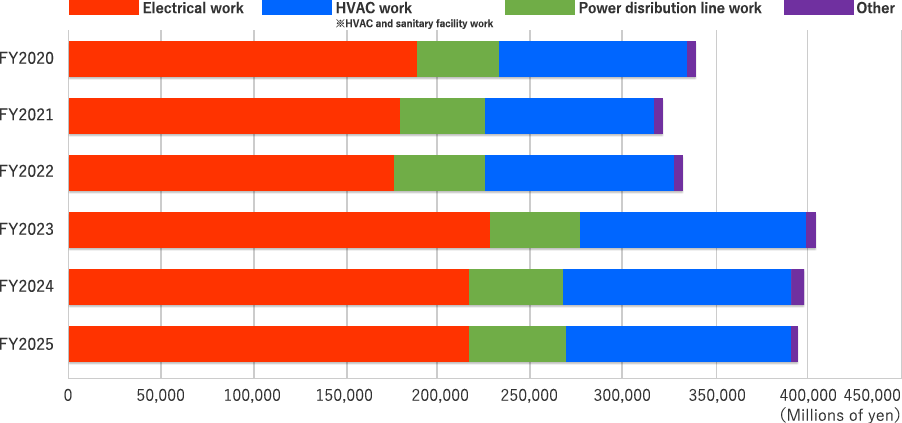
(Millions of yen)
| FY2020 | FY2021 | FY2022 | FY2023 | FY2024 | FY2025 | |
|---|---|---|---|---|---|---|
| Electrical work | 190,794 | 180,647 | 178,281 | 231,434 | 213,755 | 212,842 |
| HVAC work | 98,639 | 93,879 | 105,778 | 122,693 | 128,333 | 124,188 |
| Power disribution line work | 43,446 | 43,619 | 44,273 | 45,581 | 48,376 | 53,322 |
| Other | 4,552 | 4,422 | 4,674 | 5,123 | 8,137 | 5,293 |
Changes in Net Sales of each department (consolidated)
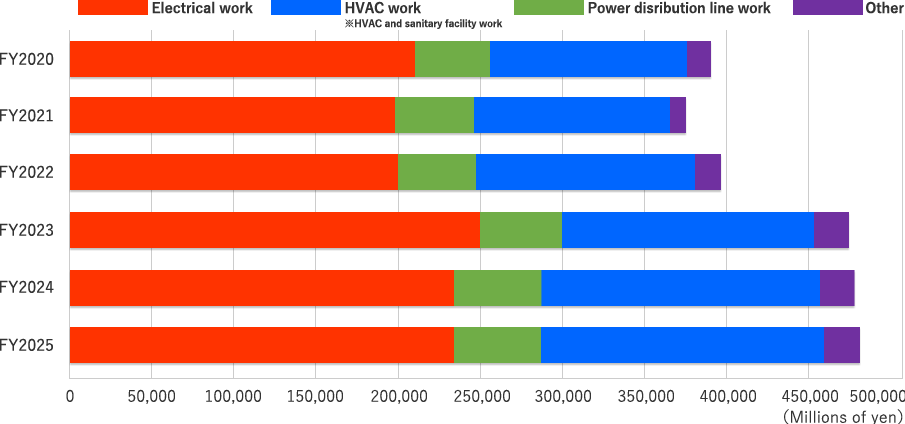
(Millions of yen)
| FY2020 | FY2021 | FY2022 | FY2023 | FY2024 | FY2025 | |
|---|---|---|---|---|---|---|
| Electrical work | 207,274 | 198,354 | 199,403 | 251,167 | 238,022 | 238,543 |
| HVAC work | 124,263 | 120,311 | 134,323 | 153,202 | 164,970 | 162,385 |
| Power disribution line work | 45,793 | 45,774 | 46,628 | 48,253 | 51,380 | 56,595 |
| Other | 14,570 | 12,123 | 15,428 | 16,433 | 19,580 | 18,598 |
Orders
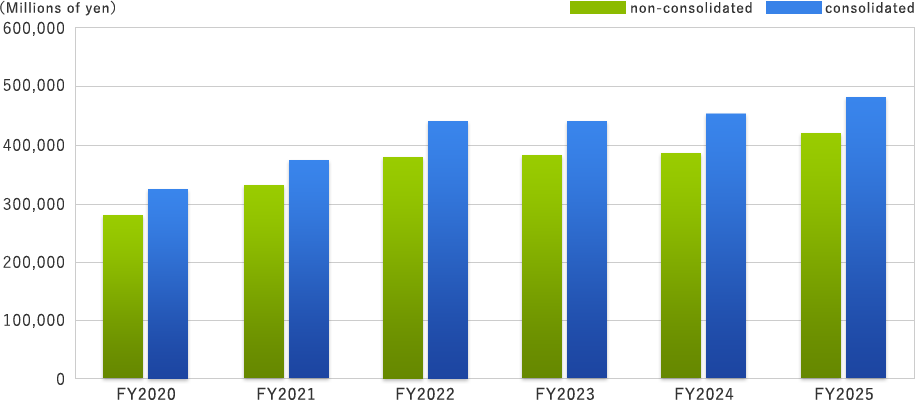
(Millions of yen)
| FY2020 | FY2021 | FY2022 | FY2023 | FY2024 | FY2025 | |
|---|---|---|---|---|---|---|
| non-consolidated | 280,717 | 332,349 | 379,286 | 381,754 | 384,019 | 417,403 |
| consolidated | 325,158 | 375,474 | 440,507 | 440,864 | 452,113 | 479,014 |
Net profit
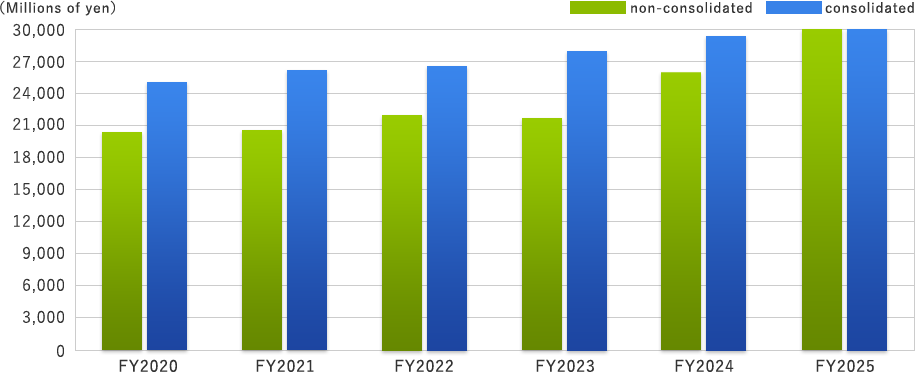
(Millions of yen)
| FY2020 | FY2021 | FY2022 | FY2023 | FY2024 | FY2025 | |
|---|---|---|---|---|---|---|
| non-consolidated | 20,393 | 20,690 | 21,806 | 21,766 | 25,944 | 32,894 |
| consolidated | 25,042 | 26,216 | 26,349 | 28,017 | 28,883 | 40,053 |
ROE
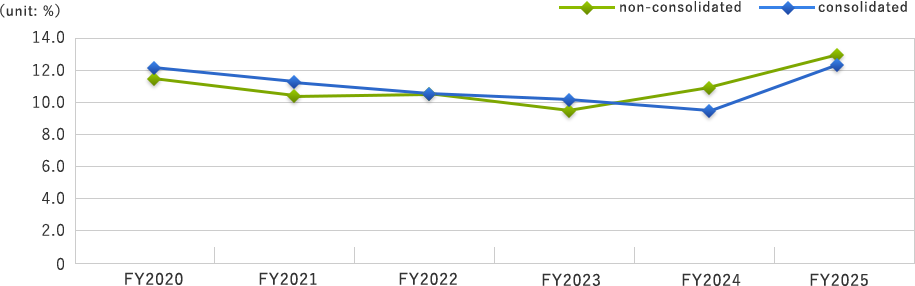
(unit: %)
| FY2020 | FY2021 | FY2022 | FY2023 | FY2024 | FY2025 | |
|---|---|---|---|---|---|---|
| non-consolidated | 11.4 | 10.7 | 10.5 | 9.7 | 10.8 | 12.5 |
| consolidated | 12.1 | 11.4 | 10.5 | 10.2 | 9.6 | 12.2 |
BPS
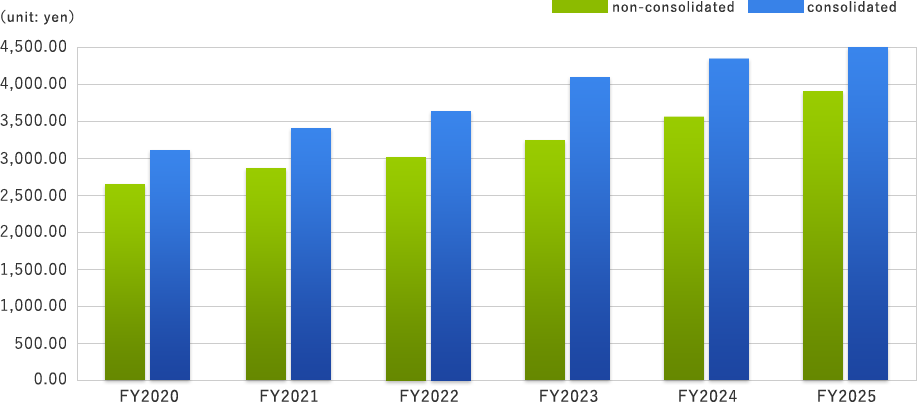
(unit: yen)
| FY2020 | FY2021 | FY2022 | FY2023 | FY2024 | FY2025 | |
|---|---|---|---|---|---|---|
| non-consolidated | 2,648.40 | 2,810.67 | 3,026.33 | 3,290.83 | 3,523.91 | 3,917.28 |
| consolidated | 3,102.61 | 3,375.43 | 3,681.85 | 4,082.95 | 4,384.30 | 4,915.49 |
PER (non-consolidated)
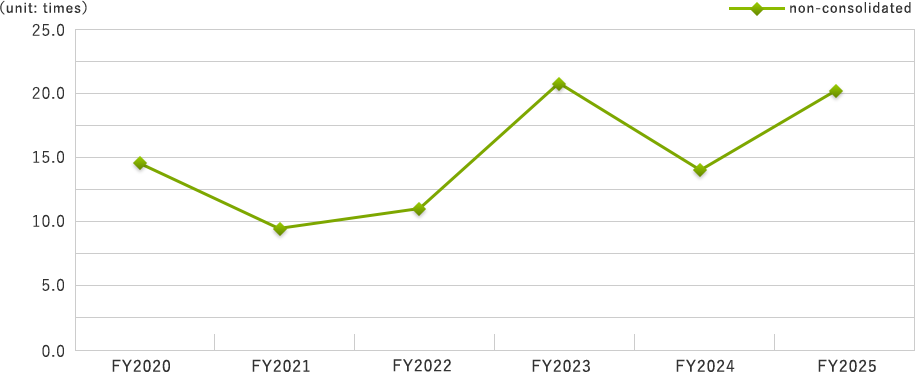
(unit: times )
| FY2020 | FY2021 | FY2022 | FY2023 | FY2024 | FY2025 | |
|---|---|---|---|---|---|---|
| non-consolidated | 14.7 | 9.8 | 10.9 | 20.7 | 13.1 | 20.1 |
Cash dividends and dividend ratio (non-consolidated)
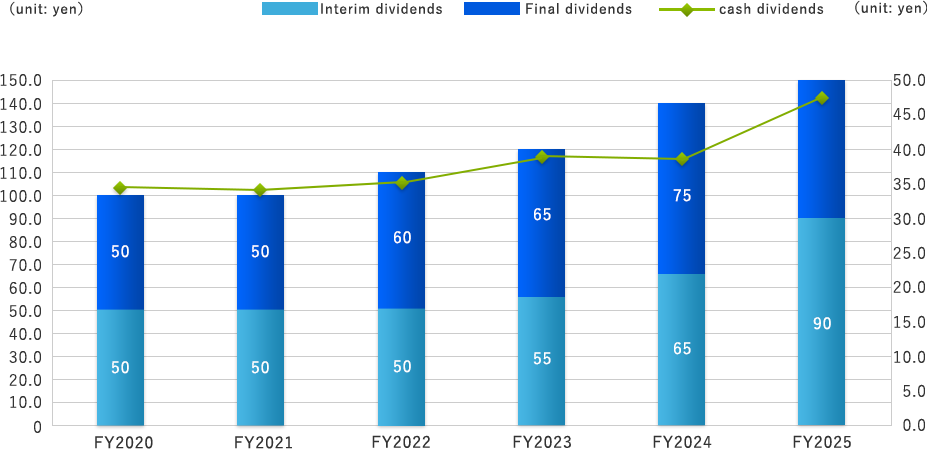
(unit: yen)
| FY2020 | FY2021 | FY2022 | FY2023 | FY2024 | FY2025 | |
|---|---|---|---|---|---|---|
| Interim dividends | 50.0 | 50.0 | 50.0 | 55.0 | 65.0 | 90.0 |
| Final dividends | 50.0 | 50.0 | 60.0 | 65.0 | 75.0 | 130.0 |
| cash dividends | 100.0 | 100.0 | 110.0 | 120.0 | 140.0 | 220.0 |
| (unit: %) | ||||||
| Dividend ratio | 34.7 | 34.2 | 35.7 | 39.0 | 38.2 | 47.3 |
Number of employees
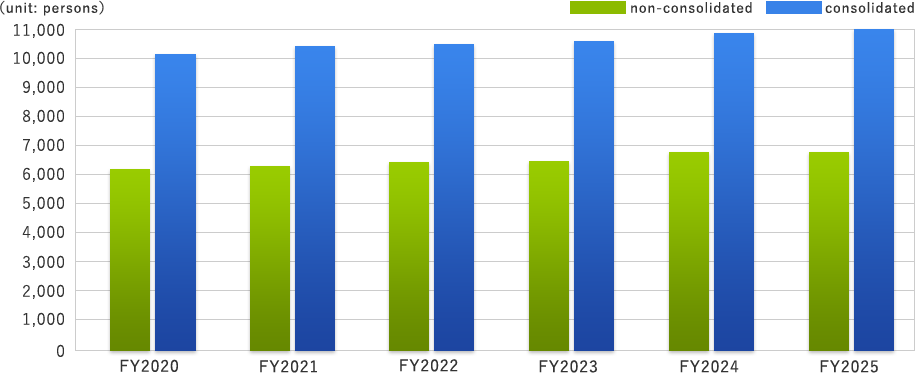
(unit: persons)
| FY2020 | FY2021 | FY2022 | FY2023 | FY2024 | FY2025 | |
|---|---|---|---|---|---|---|
| non-consolidated | 6,353 | 6,473 | 6,472 | 6,487 | 6,859 | 6,886 |
| consolidated | 10,092 | 10,425 | 10,504 | 10,572 | 10,935 | 11,122 |